


Split section
Column
Prose
Section heading
Real-time density measurement. Better process control.
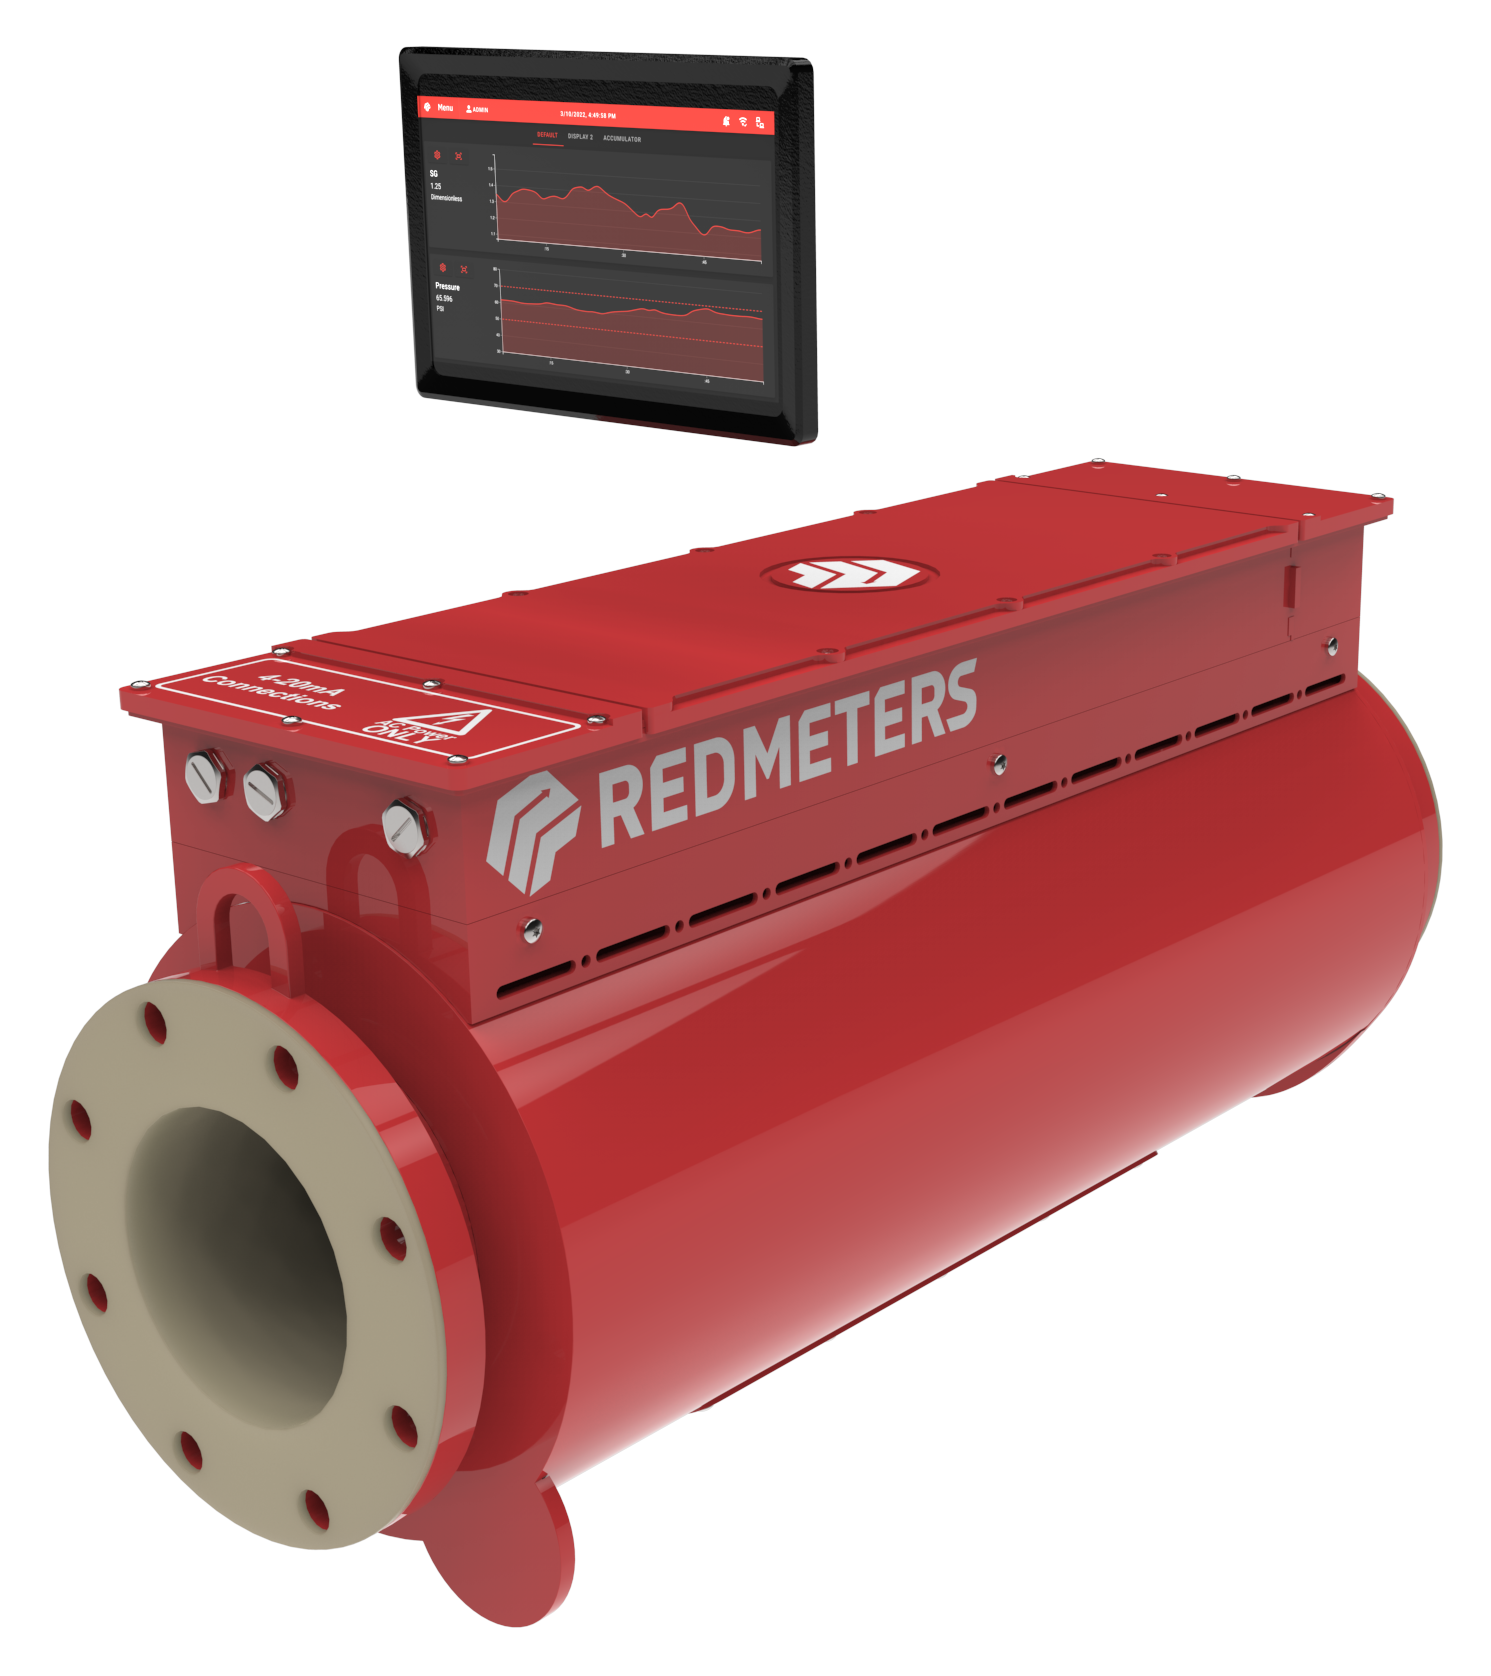
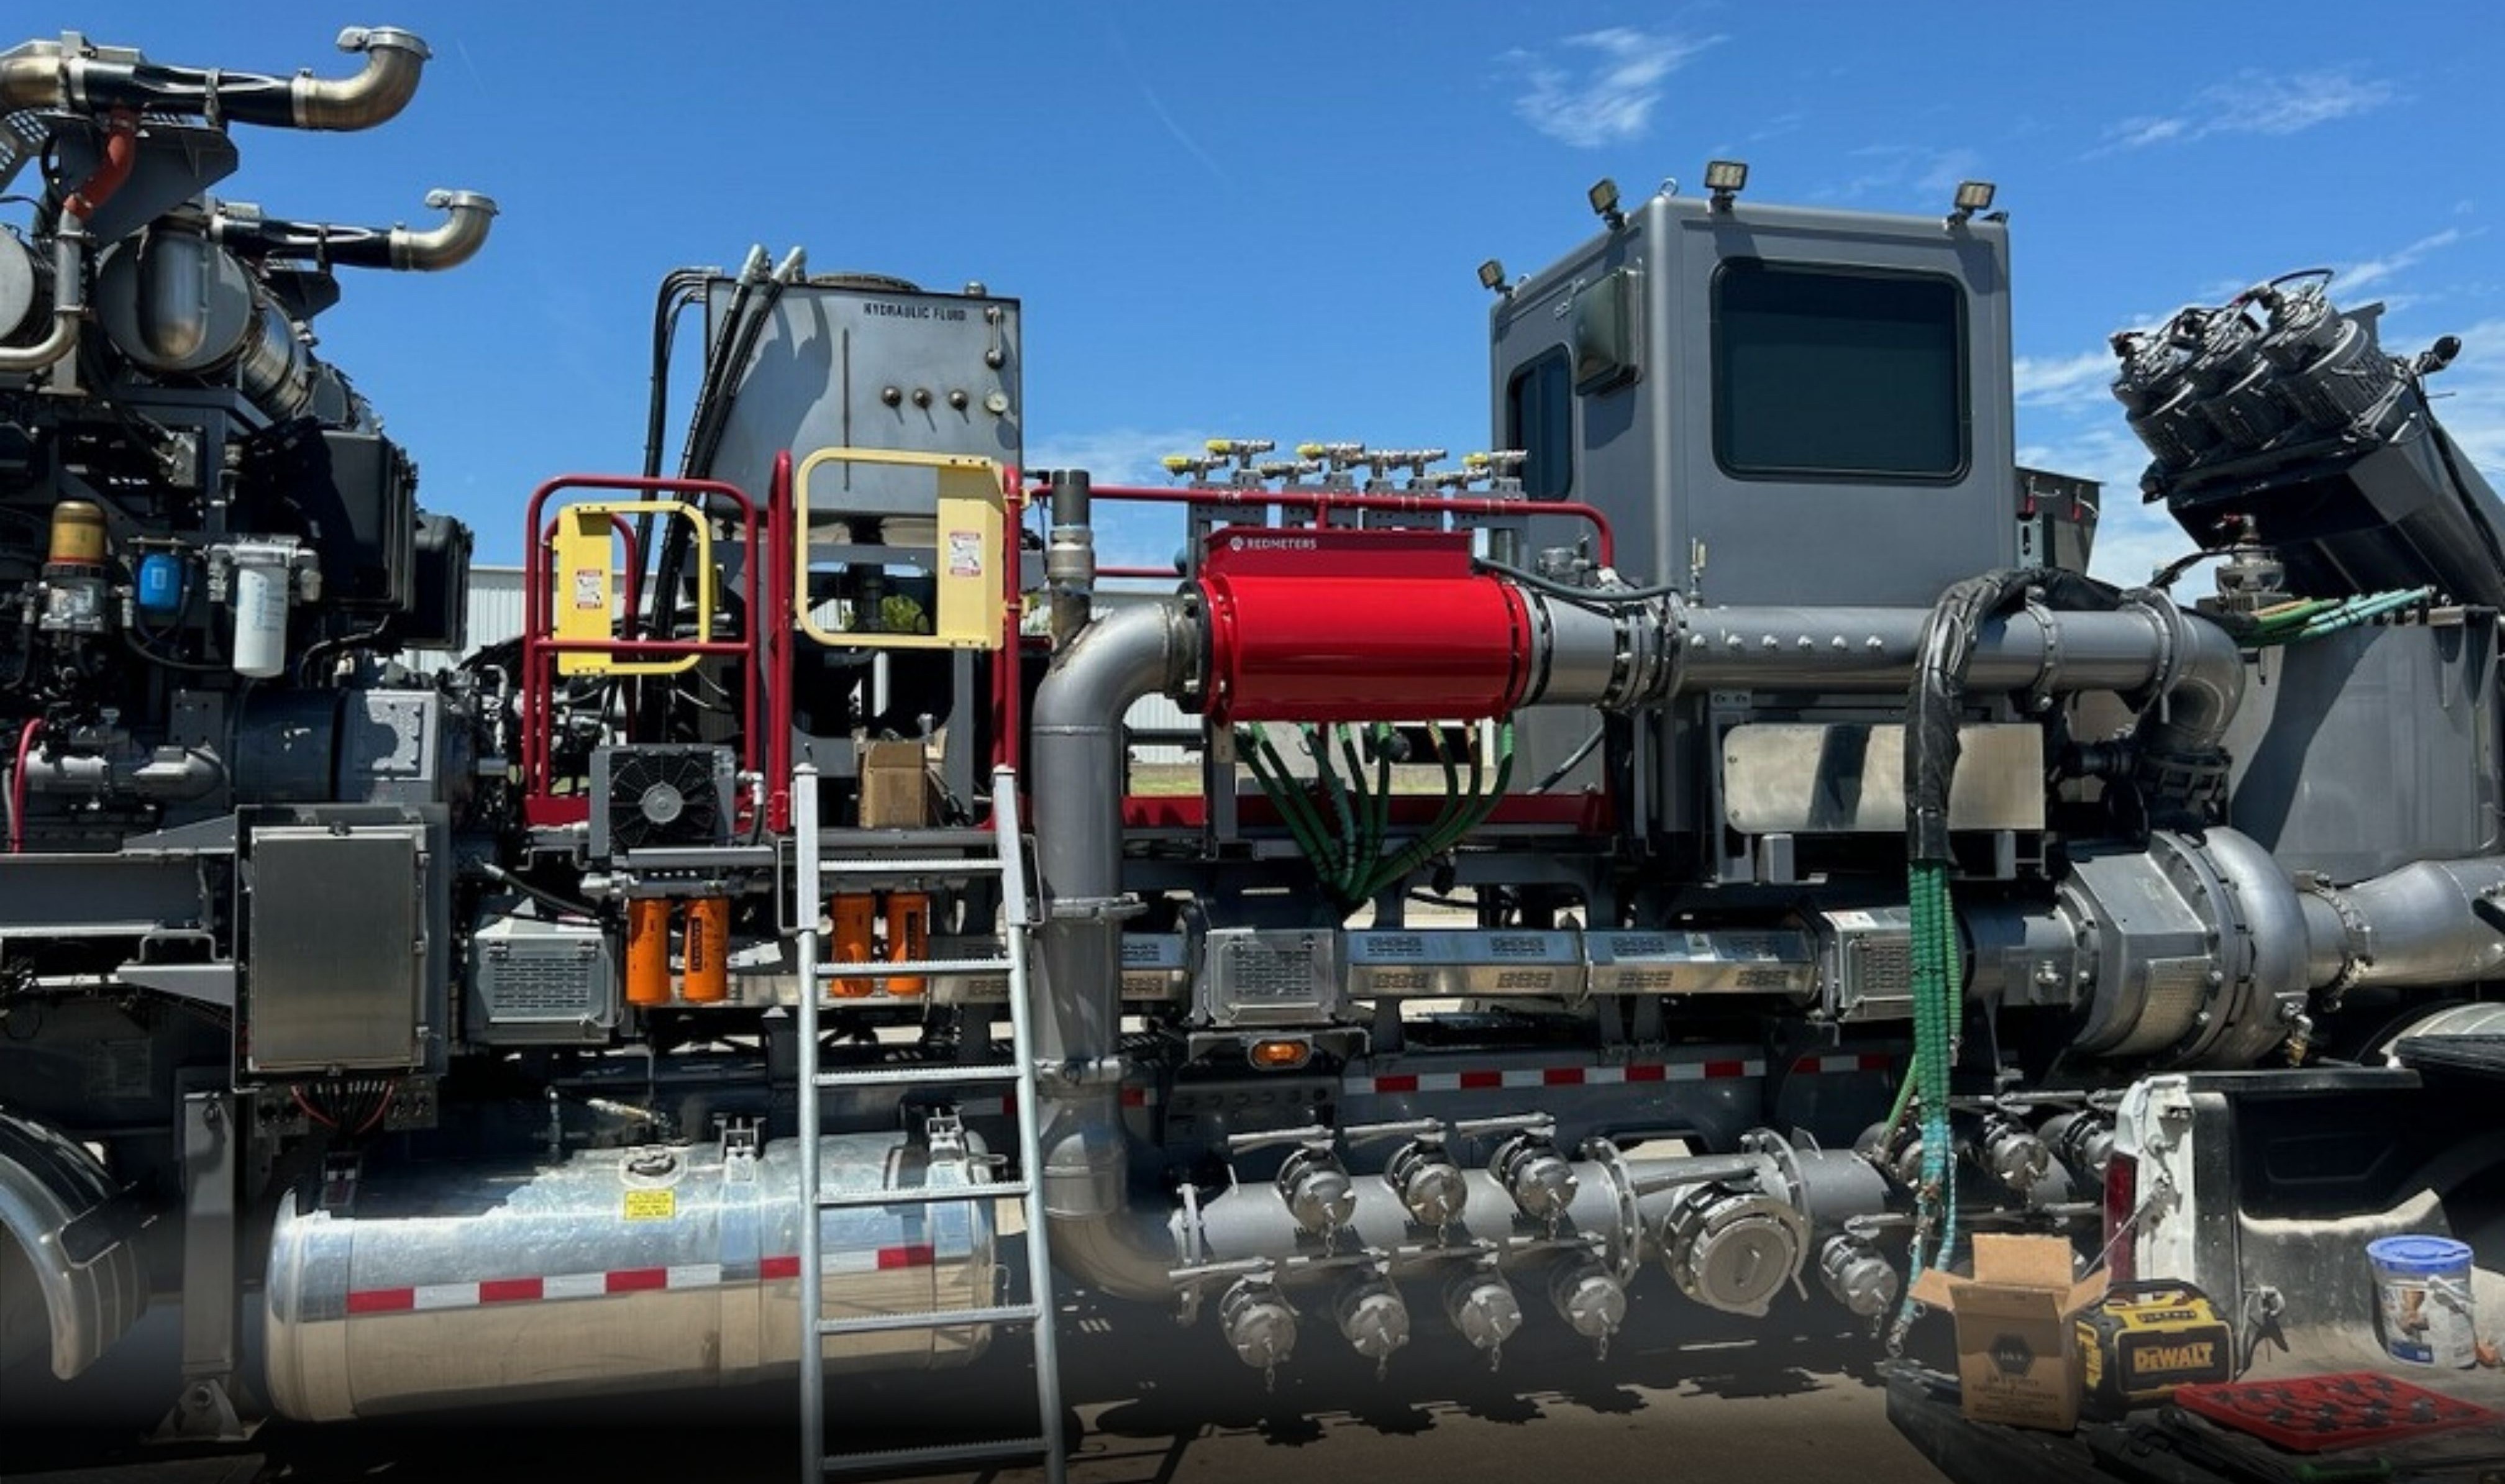
One inline instrument continuously measures slurry density, temperature, pressure and vibration, giving operators the data they need to monitor process conditions and make better control decisions.
Column
Figure, single-image
Call to action, callout
Section heading
Capstone Copper, Pinto Valley
At Capstone Copper's Pinto Valley mine, 15 paired samples were compared with the plant lab.
Button, primary
Read the Pinto Valley StudyProse
Section heading
Better decisions start with better density data
A grab sample tells you what a process looked like at one moment. Continuous density measurement shows how it changes between samples. In abrasive, variable slurry services, that difference can affect process stability, water use and material throughput. The Red Meter gives operators, engineers and metallurgists an additional real-time measurement they can compare with laboratory results and use alongside existing instrumentation.
Run on inferred density and you pay in yield. Miss air in the line and every other instrument on it is off.
Link list
Comparison table
Section heading
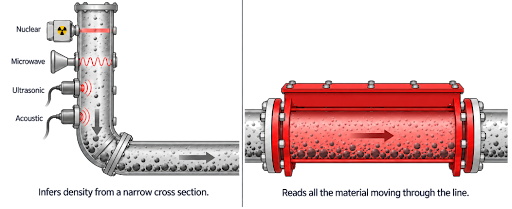
| Grab sample | Nuclear gauge | The Red Meter | |
|---|---|---|---|
| What is read | One sample | One slice of the pipe | The full bore |
| How often | Hours later | Continuous | Every second |
| Source licence | No | Yes | No |
| Instruments needed | Several | Several | One |
Feature tabs
Section heading
One instrument. Four measurements.
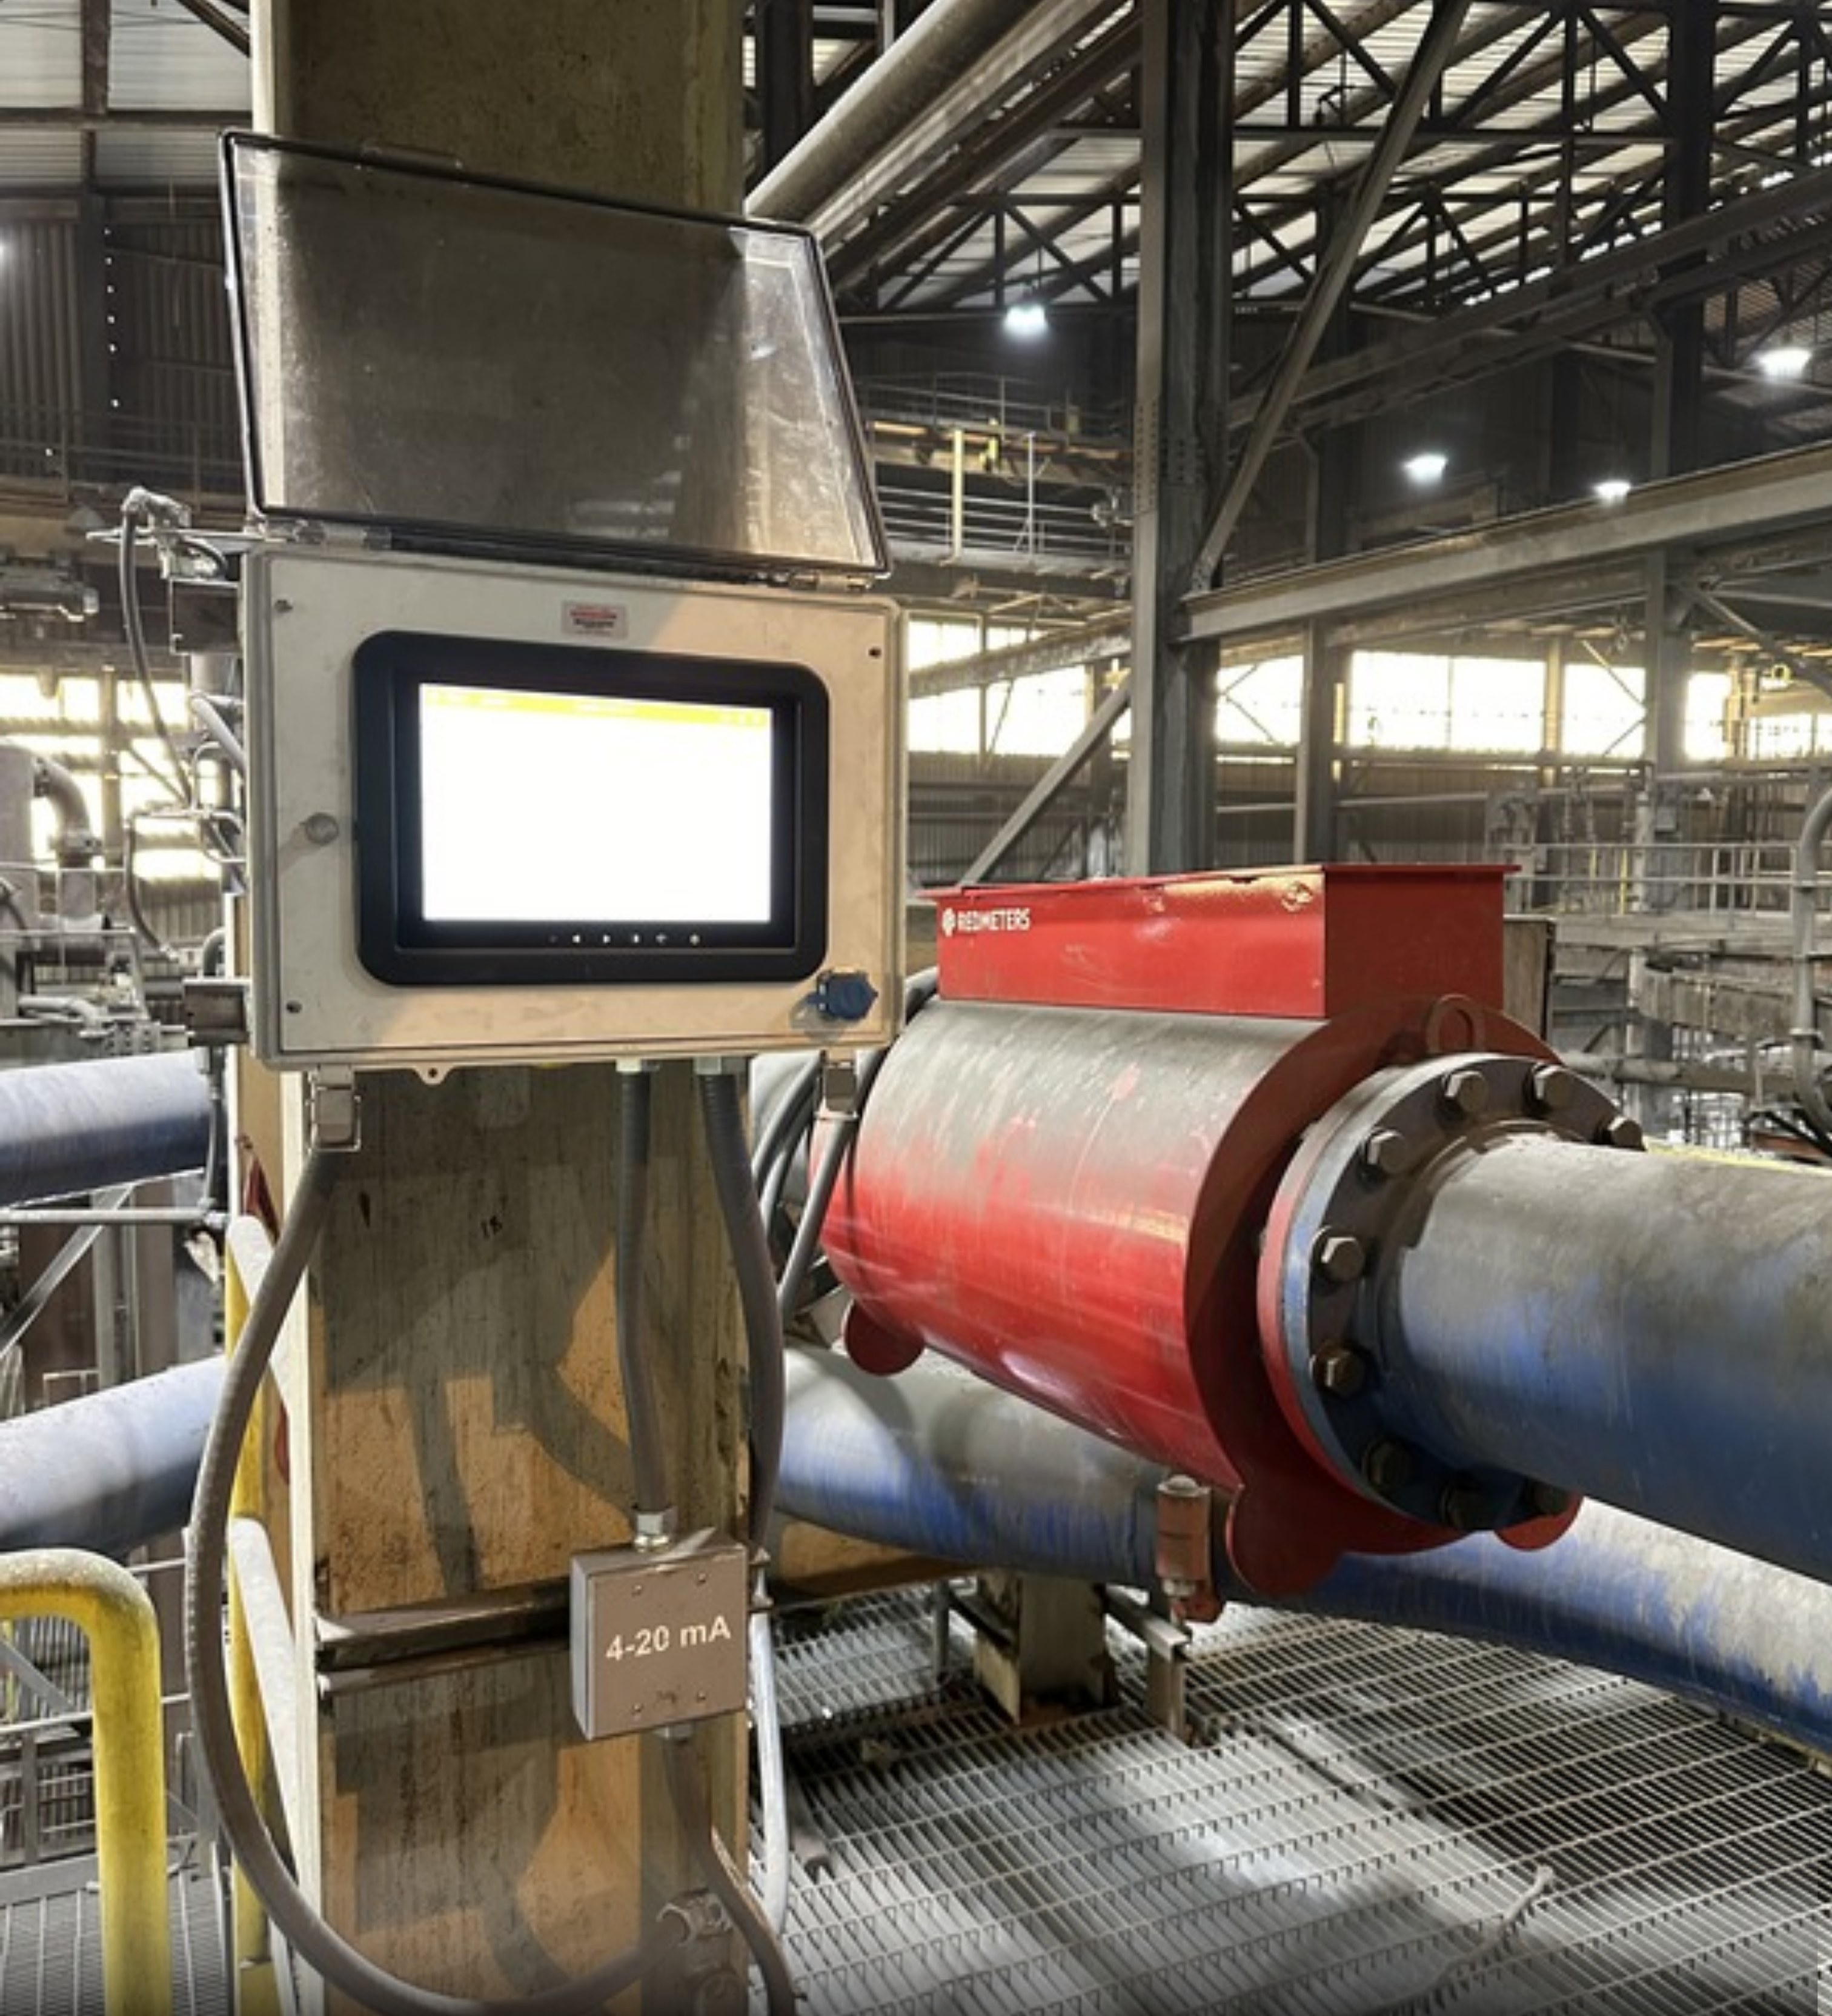
All four readings are acquired by one instrument and made available through Red Meter software and supported plant interfaces.
Density
Full-bore slurry density measurement that reflects the material in the sensing section, not only an individual measurement path.
Temperature
Monitor process temperature alongside density.
Pressure
View operating pressure at the measurement location.
Vibration
Add mechanical context to changes in the process signal.
Link list
Card grid
Section heading
Your process, live on screen.
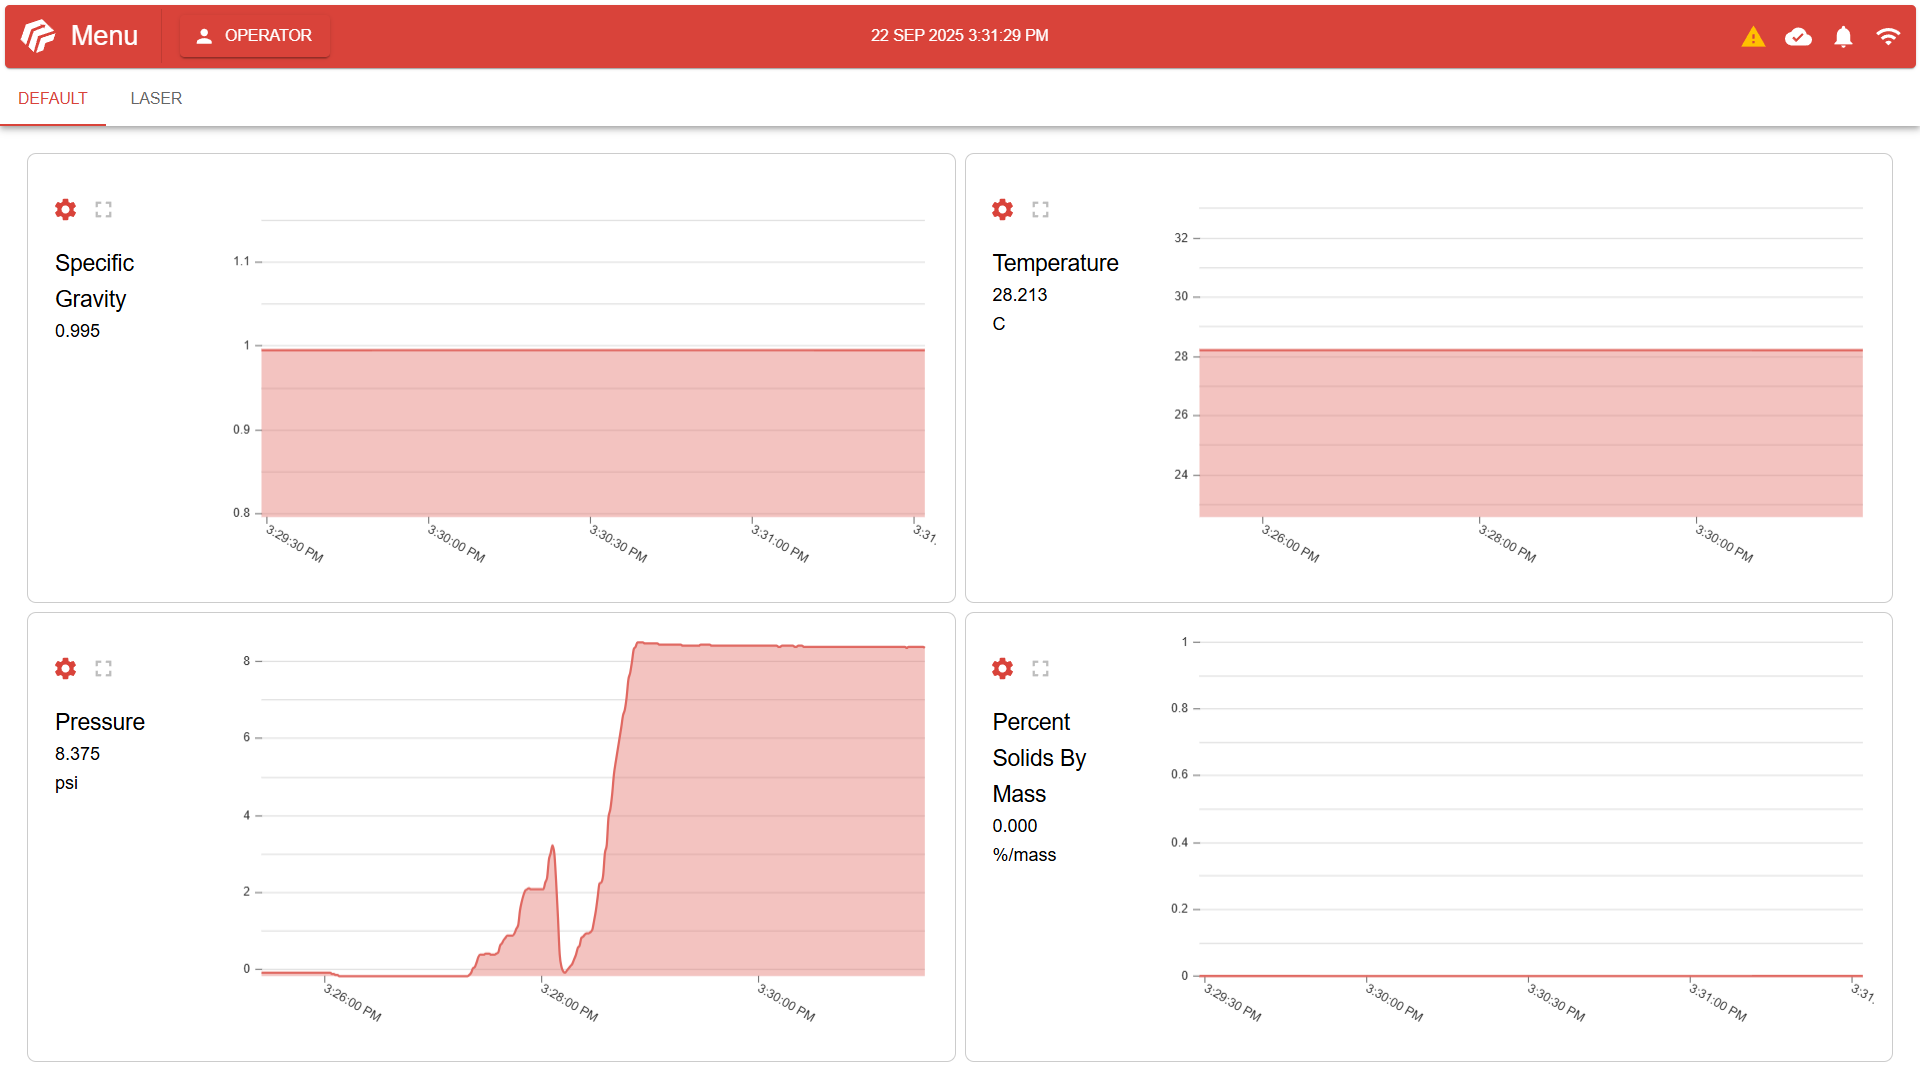
The Red Meter measures at the pipe. The Red Meter software shows you what that means for your process while you can still act on it.
Card
Every reading from the same moment
Density, temperature, pressure and vibration from one point in the pipe. Stop reconciling instruments that read different slurry.
Card
See pressure and air on the same timeline as density
Pressure and vibration are recorded with density every second, so unusual pressure events can be reviewed on the same timeline as the density reading. Air in the pipe can be reviewed with those readings.
Card
Percent solids without waiting on the lab
Percent solids comes straight from the density reading, with no extra sensor. Add your flow meter signal for mass flow and totalized solids.
Card
Full-bore density you can check
Check full-bore density against your own lab. At Pinto Valley, 15 paired samples were compared with the plant lab.
Card grid
Section heading
Results from the field
Card
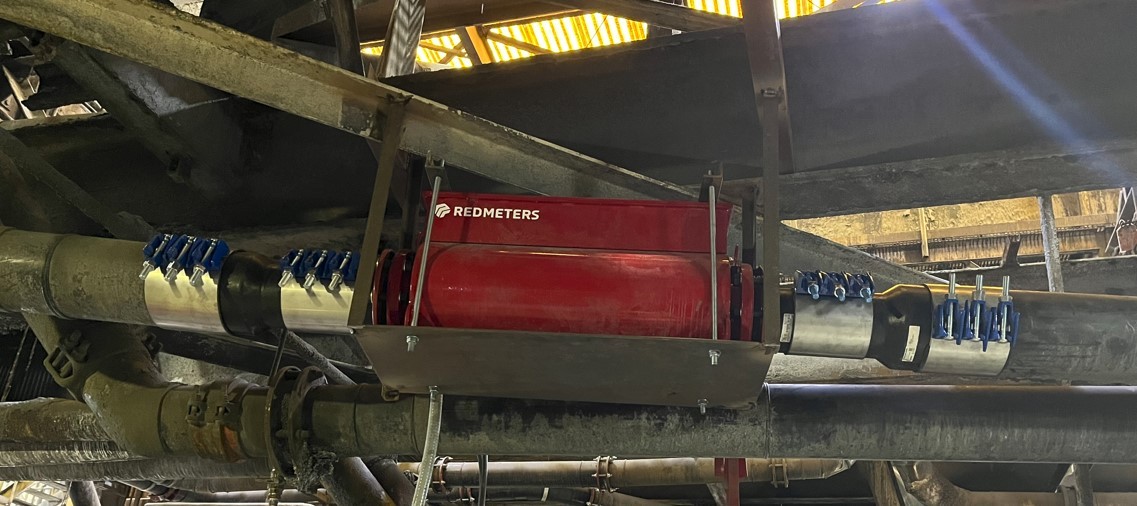
Continuous density measurement evaluated against the plant laboratory
Pinto Valley metallurgy compared 15 paired samples from a 6 in regrind cyclone feed line with the plant lab. Mean solids were 19.29% on the Red Meter and 19.23% in the lab. A t-test at 95% confidence found no statistically significant difference on percent solids or specific gravity. That result does not by itself prove the two methods are equivalent.
Card
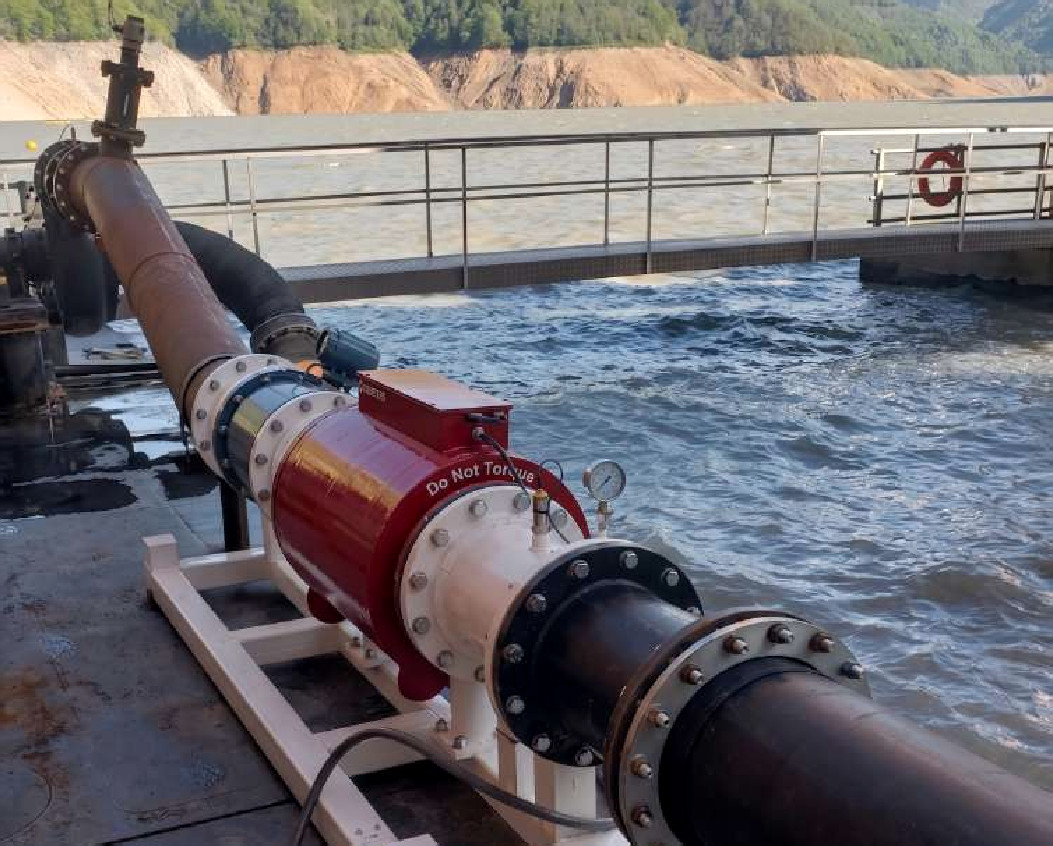
Live concentration data supported higher solids production
Mean solids rose from 24.63% to 33.54% after operators could see the live reading; solids held 60% more stable. Results vary by dredge, material and how the crew uses the data.
Card grid
Section heading
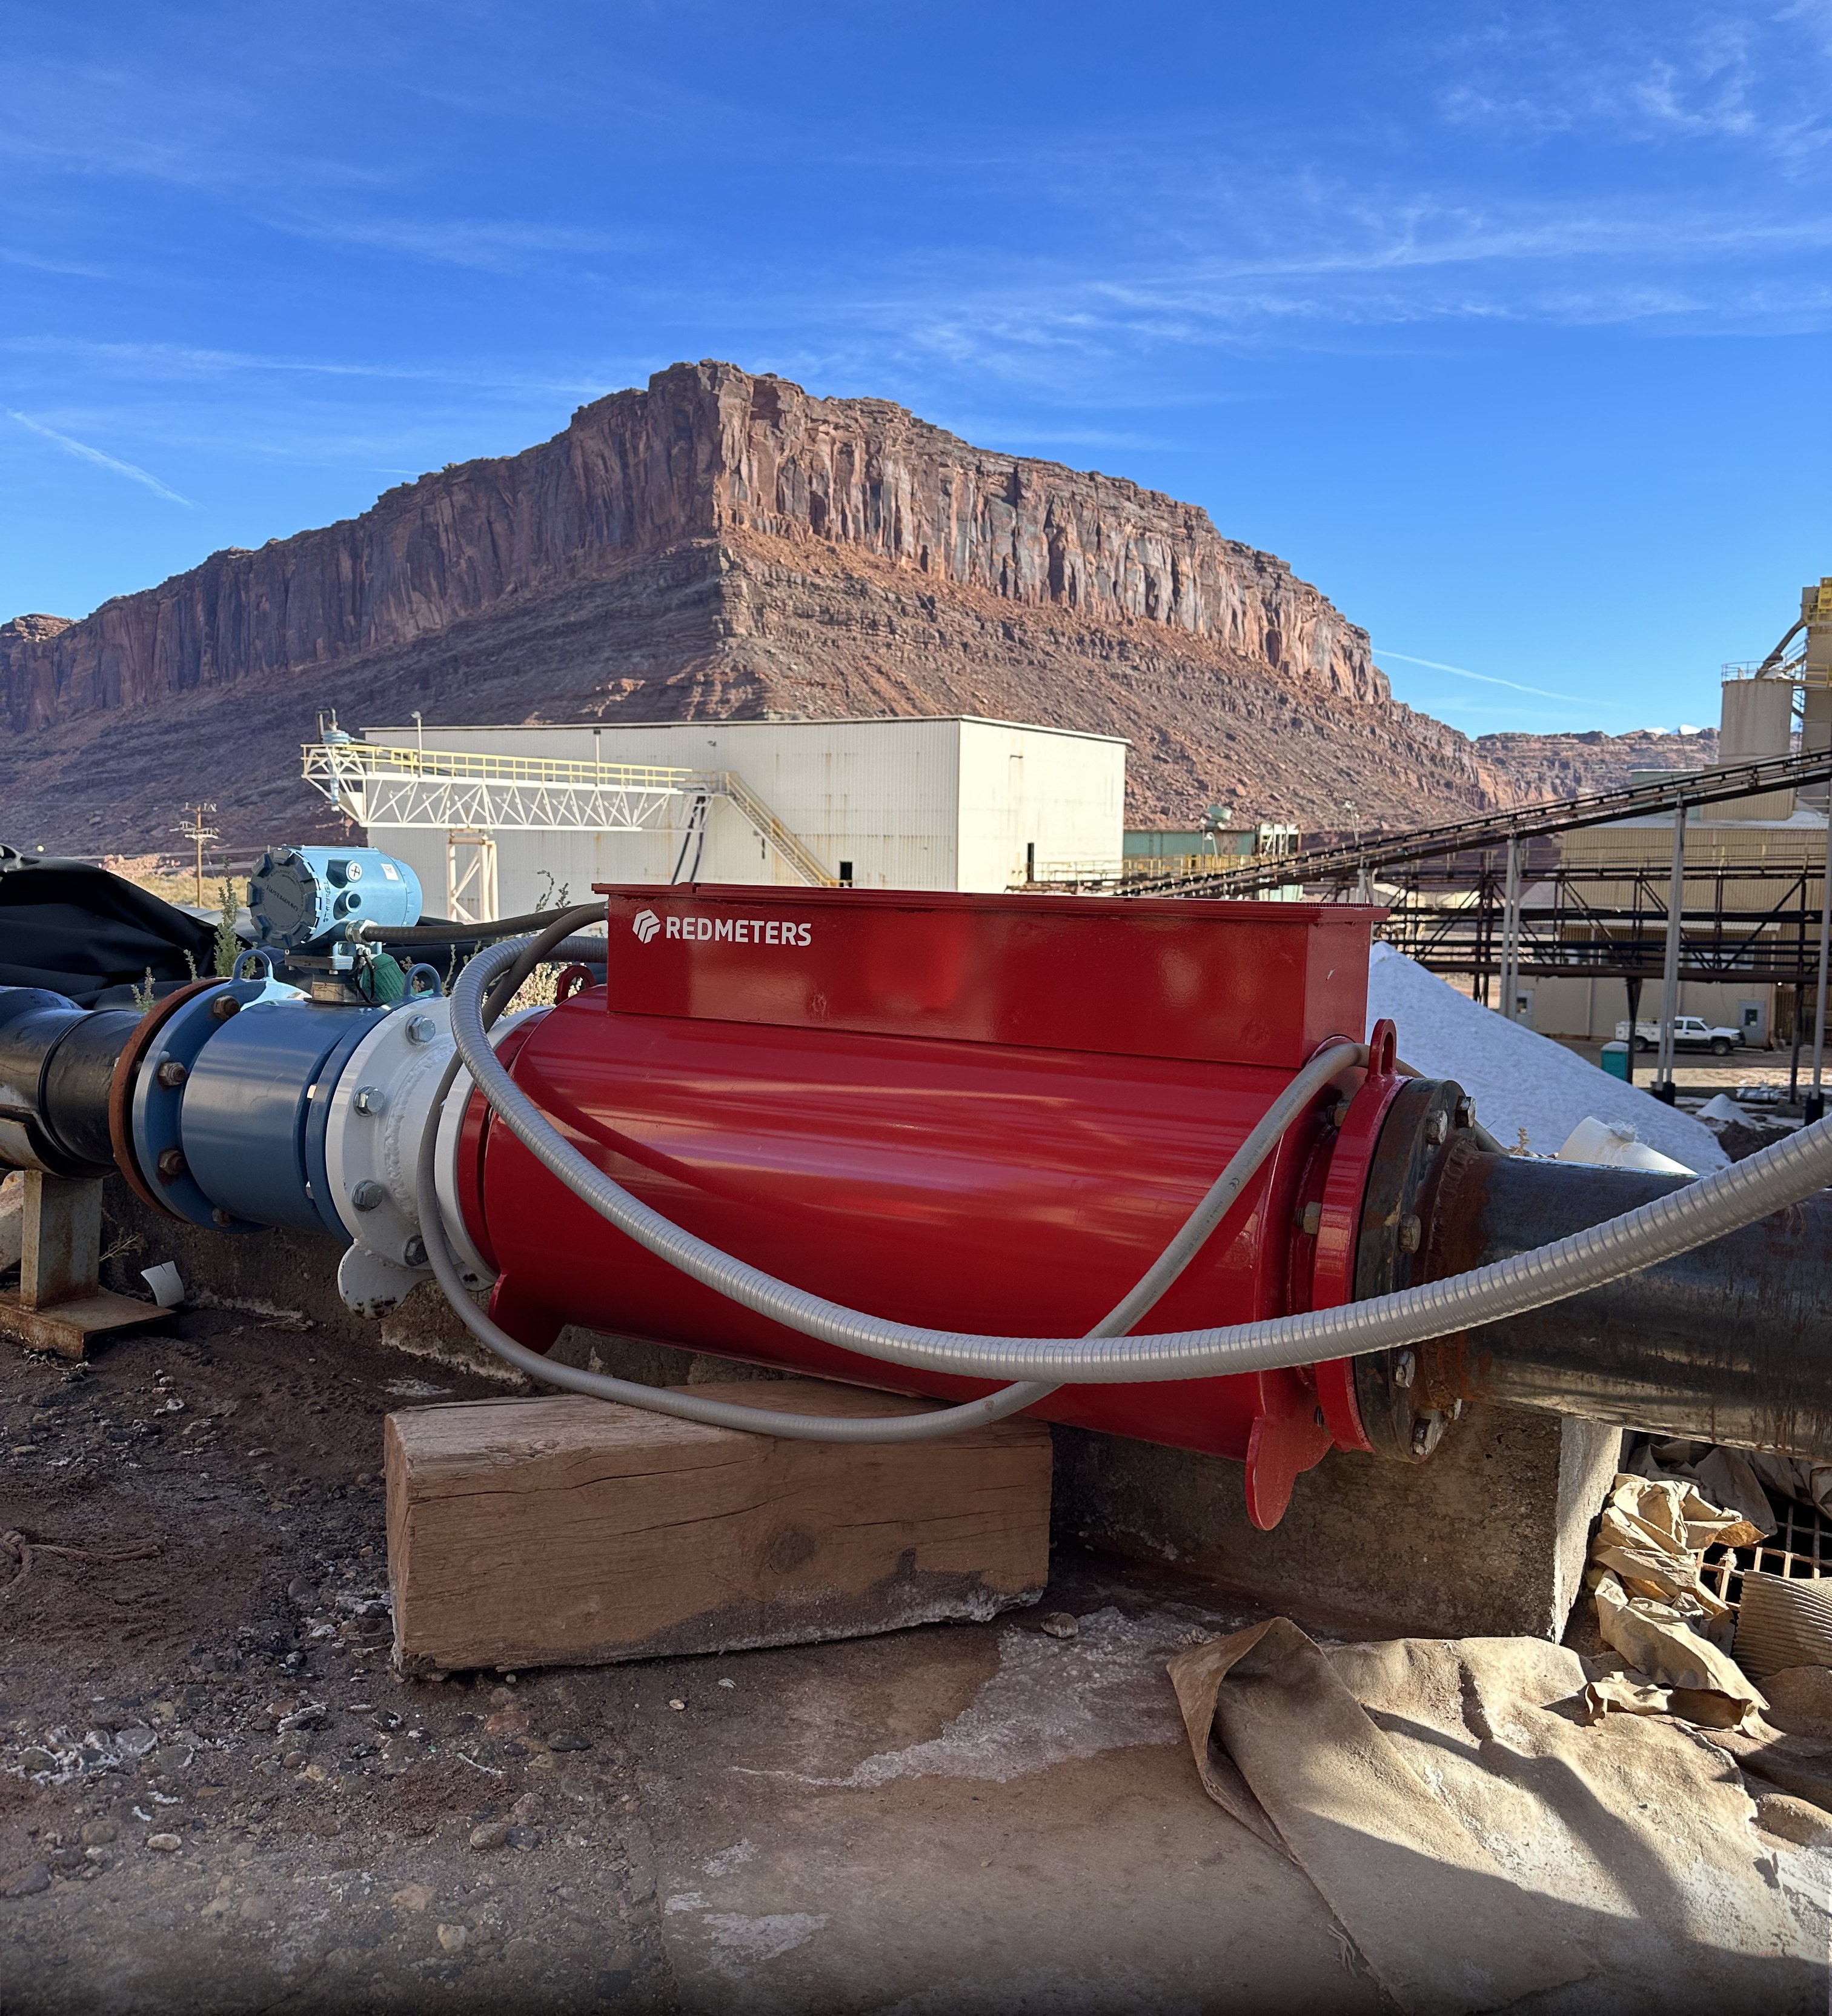
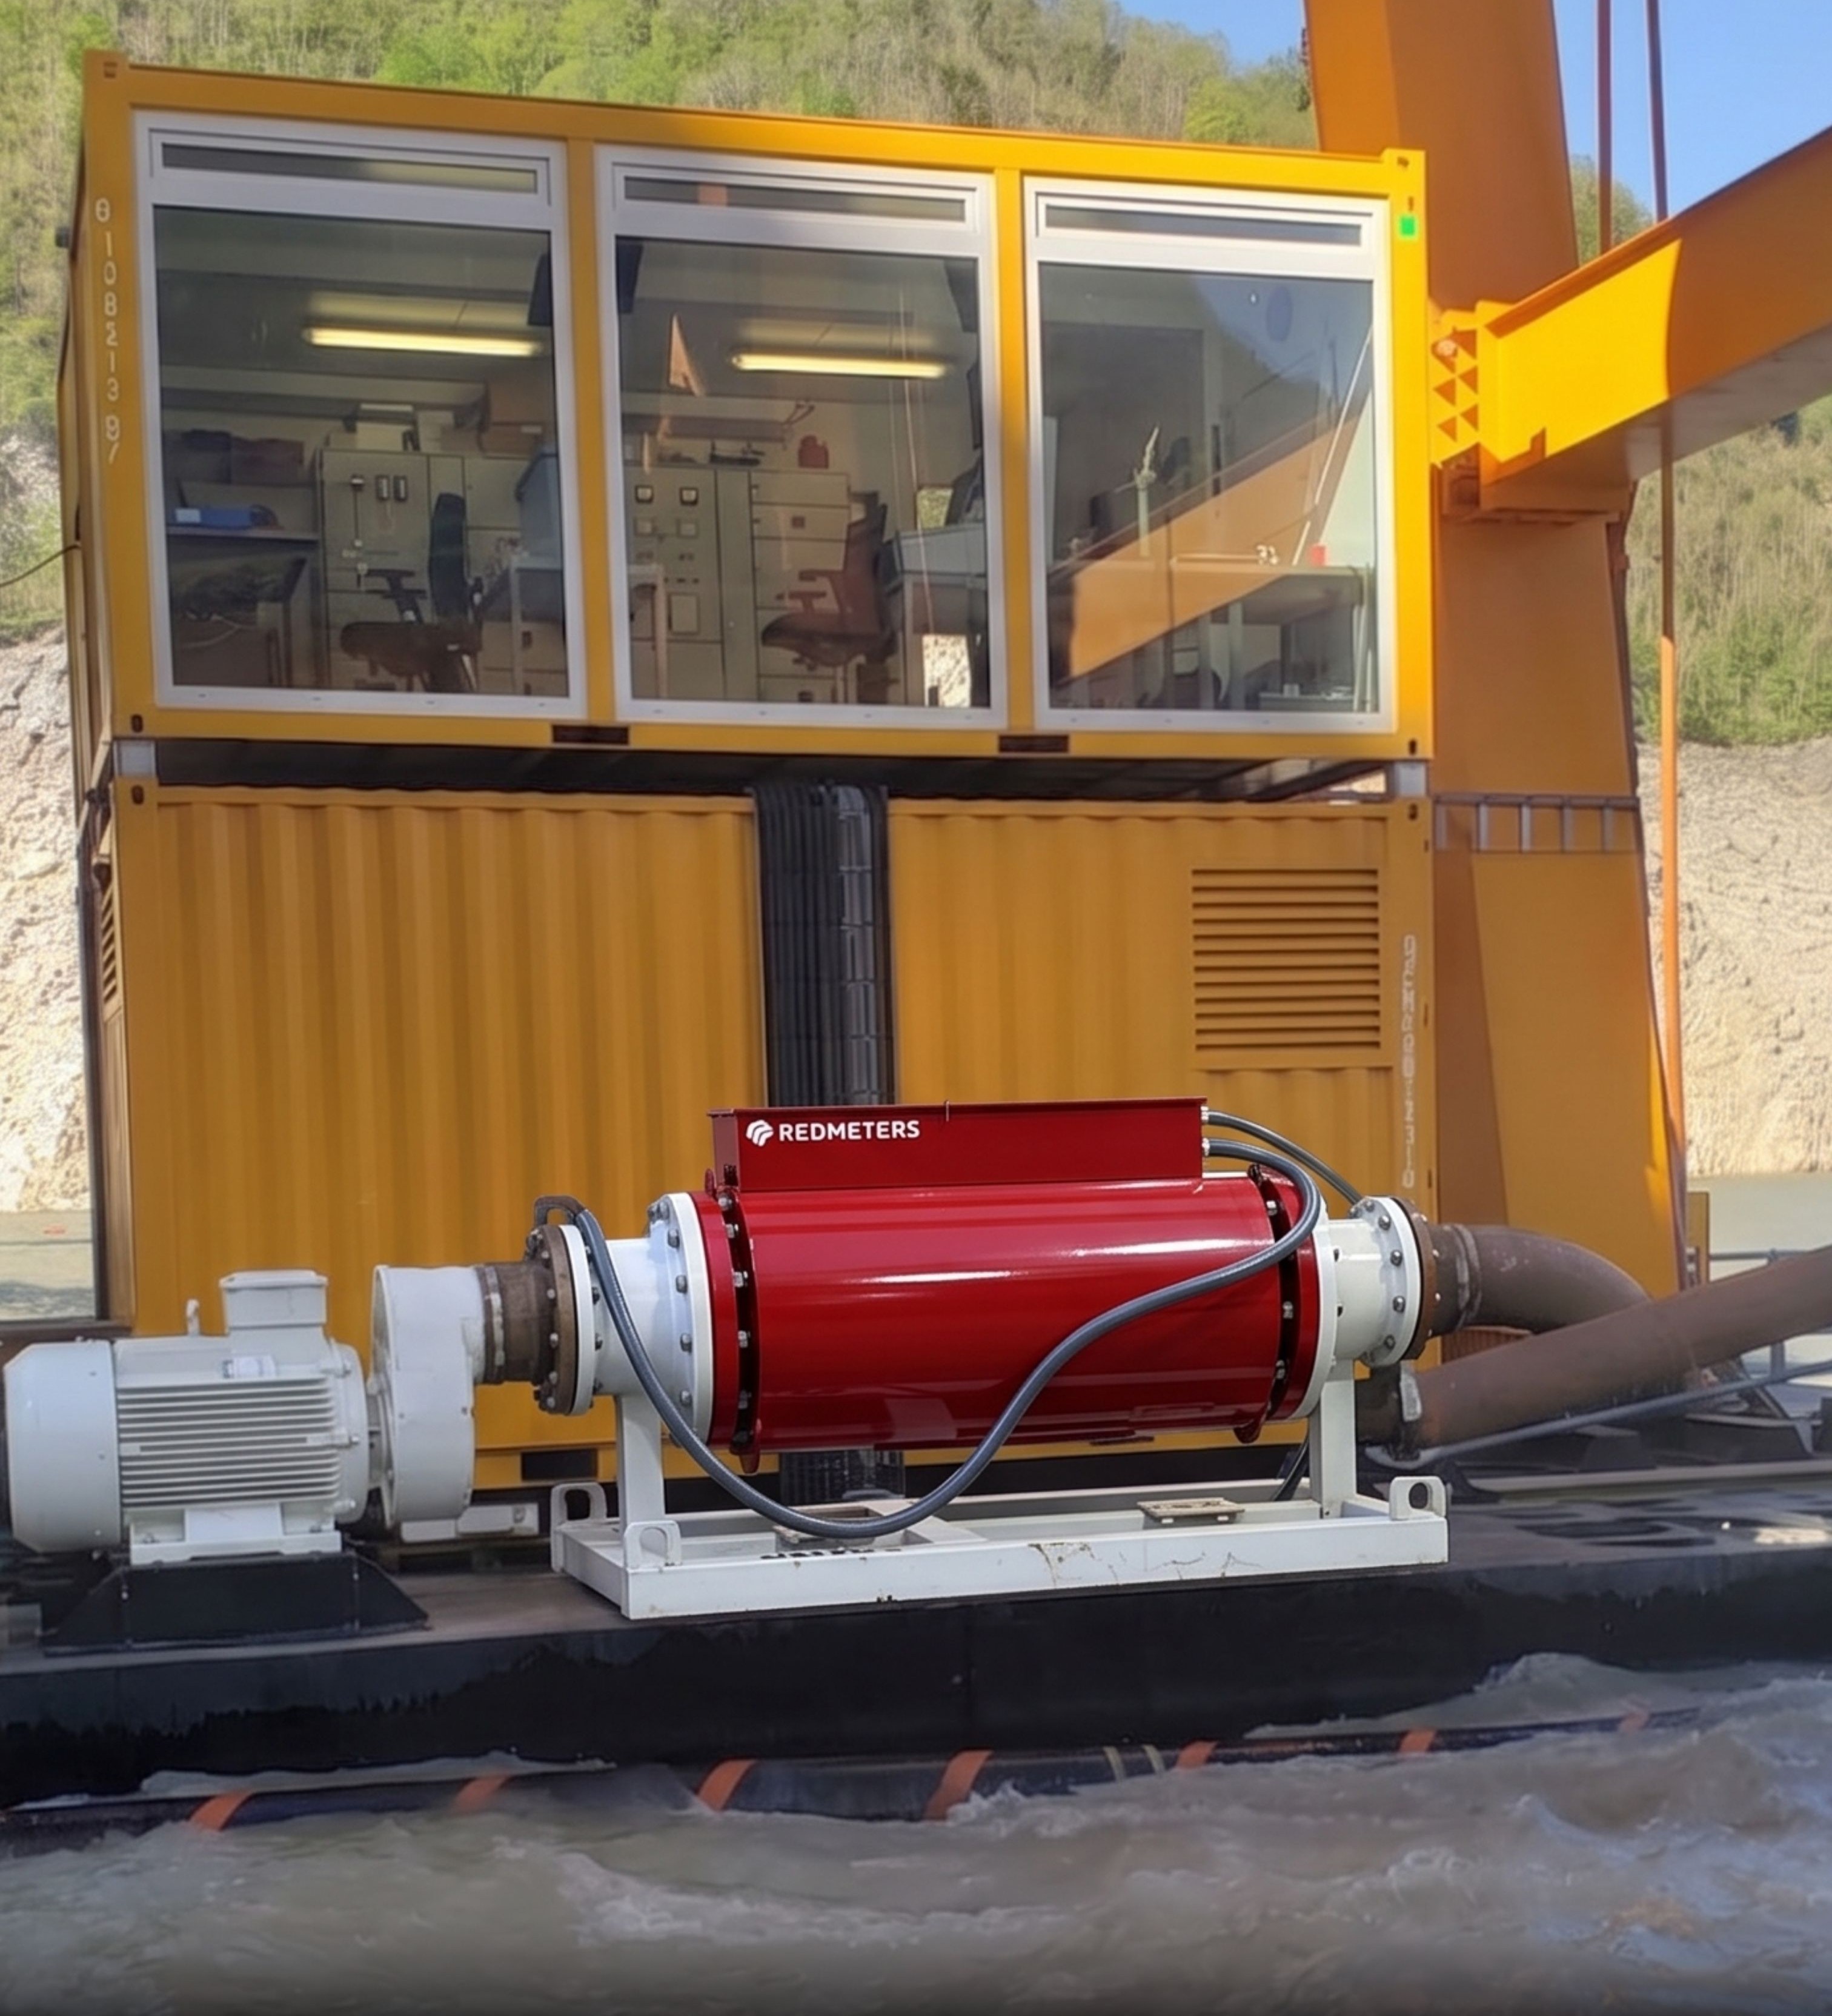
Built for demanding slurry applications
Same measurement, set up for your process.
Link list
Split section
Column
Prose
Section heading
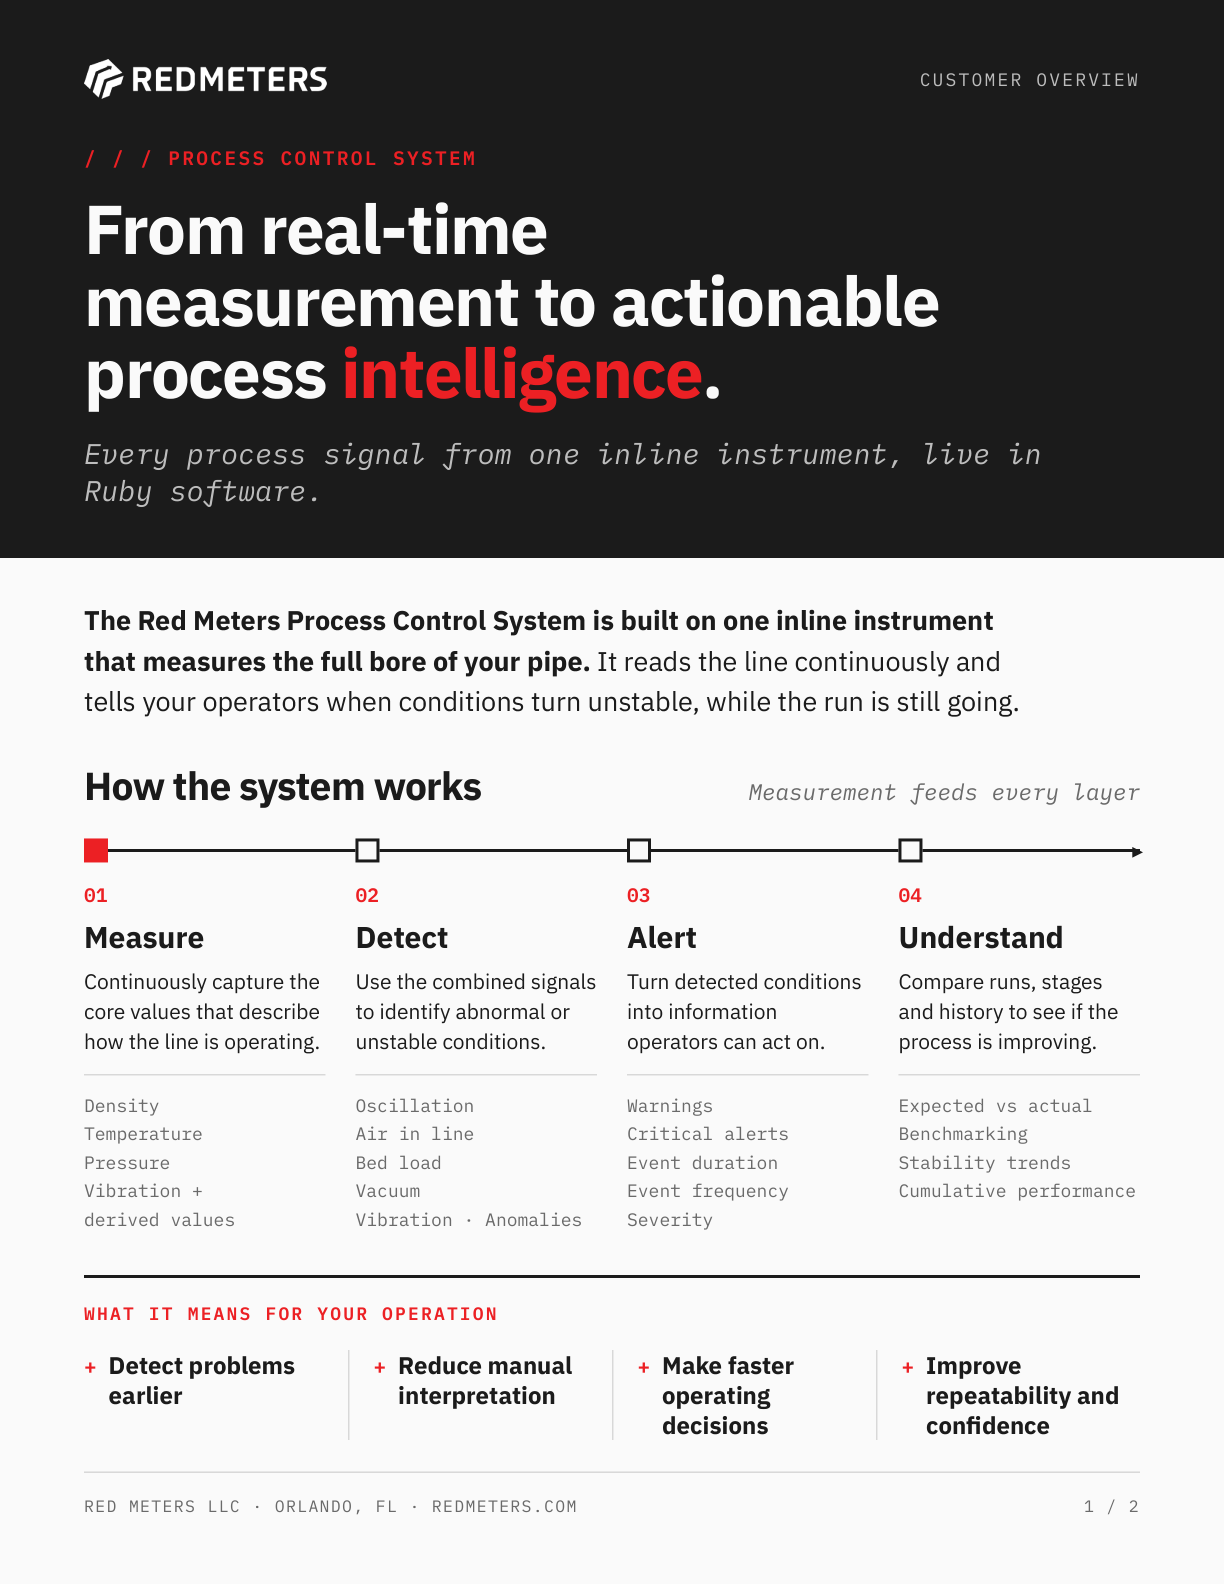
Take the details to your team.
How a Red Meter measures, with the full spec. Send it to whoever signs off the instrument budget.
Column
Figure, single-image
Call to action
Section heading
Find out if it is right for your process
Tell us what you are measuring, where the meter would be installed and what your control system needs to receive. We will review the application and show you the hardware, software and relevant field data.
Button, primary
Book a DemoFAQ list
Section heading
Questions engineers ask us.
A process control system. One inline device measures full-bore density, plus temperature, pressure and vibration from the same instrument, and Red Meter software shows it live. Percent solids comes from a Red Meter alone. Mass flow and totalized solids use your flow meter signal.
The Red Meter fits pipes from 2 to 40 in (50 to 1000 mm). It installs inline between standard ANSI, DIN, BS or JIS flanges, mounted horizontally with a maximum 5° incline. Whether it fits also depends on your operating pressure, temperature, media and piping. Book a demo and we will confirm whether it suits your installation.
Density accuracy is ±0.5% of full scale, with repeatability of ±0.3% of full scale. At Capstone Copper's Pinto Valley mine, 15 paired samples showed no statistically significant difference from the plant lab on percent solids or specific gravity. That result does not by itself prove the two methods are equivalent.
Yes. It is built for high-solids, high-abrasion slurry lines, with no probe in the flow and no bypass line to block.
Yes. Six configurable 4-20 mA outputs and Modbus TCP/IP go into the system you already run. The Red Meter software runs over Ethernet or Wi-Fi, with read-only cloud access for remote viewing.
No. The Red Meter is non-nuclear. It measures with a Class 1 laser, so you have no radioactive source to license or dispose of.
Only for mass flow and totalized solids. Density, percent solids, temperature, pressure and vibration come from a Red Meter on its own.
Operating temperature -10 °C to 120 °C (14 °F to 248 °F), storage 0 °C to 80 °C. Pressure 0 to 300 psi on 4 in to 40 in lines, and 0 to 70 psi on 2 in to 3 in lines. Install it horizontal or at up to a 5° incline. Not for use below 0 psi. A vacuum relief valve is recommended.
We commission on site, including calibration. After that we support you remotely, Monday to Friday.
Every estimate starts with your line and the outputs you need. Book a demo and we'll send one after.
Call to action
Section heading
Become a partner
Sell and support a Red Meter for your own customers. Tell us about your business and we will send you the partner pack.
Button, primary
Become a Partner